WestConnex is a proposed 33 kilometre motorway project that brings together previous plans for widening and extending the M4 motorway east of Parramatta and duplicating the M5 East, and a new north-south connection between their eastern ends. The number of traffic lanes envisaged along the route in each direction after project completion is:
- 4 lanes Parramatta-Strathfield and 3 lanes Strathfield-Haberfield (Stage 1)
- 2 lanes Haberfield-St Peters (Stage 3)
- 4 lanes St Peters-Beverly Hills (Stage 2)
An easing of congestion and more time with family are among the benefits claimed for this new motorway proposal. The following tests the veracity of these claims against the long term performance of the Sydney transport network as modelled for the current integrated transport and land use plans.
The 2011/12 Household Travel Survey1 from the Bureau of Transport Statistics provides information on past trends and present day travel conditions for the Sydney Statistical Division (SSD). It reports an almost steady average of 79 minutes of daily travel time per capita over the last 10 years.
Envisaged future trends are available from the Transport Supply and Demand Forecasts for the SSD that are presented in the Travel Forecasts 2006-20362 that have been derived from running the Sydney Strategic Travel Model3 and a crafted set of modelling land use and infrastructure assumptions used for forward planning. Given that there are some interface inconsistencies between the present day and forecast documents, the change from 2011 to 2036 is of more interest than the departure from the present day. The infrastructure assumptions are also a little dated in that the M4 and M5 works are treated as separate projects, rather than being integrated with the north-south connection and re-sequenced, however this represents a small change to the overall road network. It has turned out that a good agreement for travel distance in 2011 between the two sources has been achieved.
Estimates of total travel time cannot be read directly from the 2006-2036 forecasts, but need to be calculated from the distance for each main mode multiplied by the speed of that mode. This process understates the total time, as the slower secondary modes are not identified, e.g. feeder bus or walking to rail as the main mode, and the rail mode is also likely to be slower in off peak times. Accordingly, an additional calibration time is required to match the two sources. The total distance and time changes from 2011 to 2036 are summarised below, with a spreadsheet presentation of their derivation (before rounding error adjustments) at Annex 1.
| Distance (km/capita) | Time (min/capita) | |||||
|---|---|---|---|---|---|---|
| 2011 | 2036 | Change | 2011 | 2036 | Change | |
| Car Driver | 18.19 | 17.46 | -0.73 | 32.46 | 33.30 | 0.84 |
| Car Passenger | 5.83 | 5.22 | -0.61 | 10.40 | 9.94 | -0.46 |
| Rail | 4.29 | 5.14 | 0.85 | 6.14 | 6.73 | 0.59 |
| Bus/Light Rail | 1.47 | 1.48 | 0.01 | 4.62 | 4.80 | 0.18 |
| Bicycle | 0.07 | 0.07 | 0.00 | 0.28 | 0.27 | -0.01 |
| Walk | 0.63 | 0.60 | -0.03 | 9.49 | 9.03 | -0.45 |
| Taxi | 0.14 | 0.13 | -0.01 | 0.43 | 0.41 | -0.02 |
| Total | 30.62 | 30.10 | -0.52 | 63.82 | 64.48 | 0.66 |
| % change | -1.70% | 1.03% | ||||
| H T S total | 30.80 | 79.00 | ||||
The time and distance figures show very little change over the 2011-2036 period, with only a 2% fall in distance per capita and a 1% increase in time per capita, demonstrating clearly that substantial travel savings to allow more time with family are not being envisaged. The essentially business-as-usual figures show only modest per capita modal changes; a shift from car passenger to rail, car drivers covering less distance in a longer time, and less distance walking. The increase in rail patronage comes at a cost due to the radial nature of the network, as indicated by rail trips becoming longer (as shown in the Travel Forecasts) and by the greater than total population growth increase in outer suburban work trips to the Sydney CBD being forecast in the draft Sydney City Centre Access Strategy4. Both suggest that the jobs deficit for western Sydney is not being addressed. The increase in the average rail trip distance also sits oddly with the claim that single deck trains are needed for the NWRL to accommodate more short journeys.
However, there is a much more significant change evident in the Travel Forecasts relating to road speed, which is forecast to fall steadily by 6% over the 2011-2036 period for all-day traffic and by 9% for the morning peak. The forecasts of modal shifts are consistent with car becoming slower and rail becoming faster, indicating that the assignment forecasting model is well behaved and suggesting that road congestion has become endemic to the transport network. The corollary is that the use of private road transport should be minimised in large cities and conurbations wherever possible, through land use changes and public transport improvements to avoid the impact of congestion, rather than be expanded through more road capacity. An awareness that travel time elasticity could be -0.5 in the shorter term and of the order of -1.0 in the longer term for road building in congested areas dates back as far as 1994 when the landmark study on generated traffic by the UK Standing Advisory Committee on Trunk Road Assessment5 was released. The endemic nature of urban road congestion has important implications for some Sydney freight traffic (the total is forecast to grow 30% faster than population over the period) that is unable to take advantage of the avoidance measures.
In terms of an overarching objective to make Sydney more liveable, prosperous and sustainable, the lack of any time savings to alleviate the present frustrations suggest no improvement for the first. With little change to the distance travelled, and likely higher real energy prices, real transport cost increases can be expected to have an adverse impact on prosperity, and a significant reduction in greenhouse gas emissions for better sustainability would only be possible through widespread decarbonisation of transport energy generation and delivery.
With no long term prospect for any improvement in travel conditions, it is not surprising that more attention is paid to specific projects rather than to the performance of the overall network. This is because benefits for some people can be clearly identified while the gradual deterioration for all the rest can easily be understated through being too amorphous. The traditional approach has been to model the overall transport network for the same trip demand with and without the specific project and claim the reduction in generalised travel costs after reassignment as benefits, however this fixed matrix approach ignores the short and long term feedback into demand caused by time savings in accordance with the travel time elasticities mentioned above. Accordingly, multiple model runs are required to iterate demand changes to optimise overall network performance with and without the project to provide a valid estimate of benefits.
The cost of avoidable road congestion is currently estimated to be around $5.5 billion per annum and rising faster than population due to an "infrastructure backlog". However, the Travel Forecasts indicate that even with WestConnex and a number of other major road projects introduced during the 2011-2035 period, congestion increases will still outpace population growth. The best that can be argued is that the road projects could slow the rate of congestion growth without it being clear by how much or if at all.
Much has been written about adopting a polycentric structure for large cities, with research suggesting that this would be efficient provided there aren't too many agglomeration clusters, they are well connected (to the centre and also usefully to each other) and not too far apart. The main benefit would come from reducing the need to travel. The basic idea is that for agglomeration to be achieved employers need to have access to a wide range of labour and residents need to have access to a wide range of employment opportunities. At present these conditions are best met by the Sydney CBD at the cost of long commutes by individual employees. Intelligent work and education hubs supported by modern telecommunications facilities can be an emerging facilitator of more employment in suburban agglomeration hubs. By becoming more attractive to live near, such agglomeration hubs could also alleviate some of the affordability stresses in the housing market.
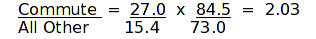
Data from the Household Travel Survey for Sydney shows the commute represents 15.4% of all trips but 27% of the distance travelled. Considering that the remaining 84.5% of trips for all other purposes cover the other 73% of the distance travelled it is easy to establish that the commute is twice as long as the average for all other trip purposes:
Given that the commute represents 24% of the total travel time per capita of 79 minutes, a halving of the commute distance to bring it in line with the average for all other purposes would save 9.5 minutes if commute speed can be preserved. Accordingly, the cost of this measure of Sydney's inefficient job distribution can be put at around $2.5 billion* per annum, and possibly more if weekends are included. In theory, considering that the commute is mostly in peak periods, this reduction would also have a significant impact on congestion that can be counted as an additional benefit from reducing the average commute distance. However, given that congestion is endemic, a better way to realise this benefit would be to recover more road space for localised activities.
* 4.476m x $14.5 x 48 x 5 x 9.5 / 60
Planning consultants to the NSW Government have recommended a more strongly polycentric land use structure as a sustainable way forward, however this has tended to be taken as advice to be heeded after the (politically more urgent) infrastructure backlog has been addressed rather than as an alternative way of addressing it. Given the endemic nature of congestion noted previously, the polycentric approach, and the rail, or rail-like, infrastructure needed for its shaping and support, warrants more immediate attention. Light rail plans, such as those proposed from Parramatta, seem unlikely on their own to have enough reach to be effective in improving the agglomeration prospects in suburban centres, given the large difference in service speeds compared with heavy rail.
Where does the above leave WestConnex with its useful connectivity for at least some freight traffic? The present proposal to accommodate a business-as-usual growth in personal car use offers a tempting source of toll revenue to improve the business case, despite the prospect of endemic congestion. It is also unlikely that the freight industry would be interested in a shared solution with private car travel if it was aware that congestion on public roads in large cities is endemic. Additionally, having the freight industry pay more of its costs for road access, rather than receive a form of support from private cars, should strengthen the business case for more use of environmentally friendly rail transport where appropriate.
With congestion shown to be endemic, and avoidance wherever possible seen to be the best approach, it appears to this writer that a solution to cater solely for freight, and for cars just on the first stage that completes a "missing link" and clears Parramatta Road through Concord, coupled with more interventionist land use changes and matching cross-suburban public transport links to reduce the need to travel, would have a much better chance of meeting the mobility needs of an acceptable future city target. In this solution, one lane each way of the widened and extended M4 between Parramatta and the City West Link at Haberfield would be only for trucks, and the rest of WestConnex to King Georges Road at Beverly Hills would be a single two-lane truck tunnel wide enough to accommodate breakdowns and with appropriate access to Port Botany and Sydney Airport. The resources saved by reducing the scope of WestConnex would be redeployed on congestion avoidance measures: public transport and land use.
Specifically for Stage 1, some of the intersections would need to be designed to allow for truck access to the dedicated truck lanes, however these lanes would not be activated (for any traffic) until the subsequent truck-only stages 2 and 3 were completed.
The primary need for a major transport project evaluation is a future city target point with quantified metrics for liveability, prosperity and sustainability. This is the "what kind of city do you want" question. Once this is negotiated with the community, individual projects that fit with the target point can be approved subject to local environmental impact issues being resolved. Essentially, this is how the new planning system is being structured.
The NSW Government has put a surprising amount of its political capital into WestConnex, despite the lack of any detailed analysis, and seems intent on building institutional mass to push it through. In the absence of a community agreed future target for Sydney with quantifiable metrics, this process is essentially short term and risks becoming haphazard once more information becomes available.
1 2011/12 Household Travel Survey (Summary Report 2013 release) http://www.bts.nsw.gov.au/ArticleDocuments/79/r2013-08-hts-summary.pdf.aspx
2 TransFigures (Travel Forecasts 2006-2036, February 2012 release) http://www.bts.nsw.gov.au/ArticleDocuments/80/trans2012_02_travel_forecasts.pdf.aspx
3 BTS InfoSheet (Strategic Travel Model, February 2012 release) http://www.bts.nsw.gov.au/ArticleDocuments/136/is2012-02-stm-standard-outputs.pdf.aspx
4 Sydney City Centre Access Strategy (September 2013 draft) http://www.transport.nsw.gov.au/sites/default/files/b2b/publications/SCCAS-For-further-consideration-8.3.pdf
5 The UK Standing Advisory Committee on Trunk Road Assessment (Trunk Roads and the Generation of Traffic, December 1994) http://webarchive.nationalarchives.gov.uk/+/http:/www.dft.gov.uk/pgr/economics/rdg/nataarchivedocs/trunkroadstraffic.pdf